
 Apply Now

How Data Transforms Business Decisions in the Digital Era
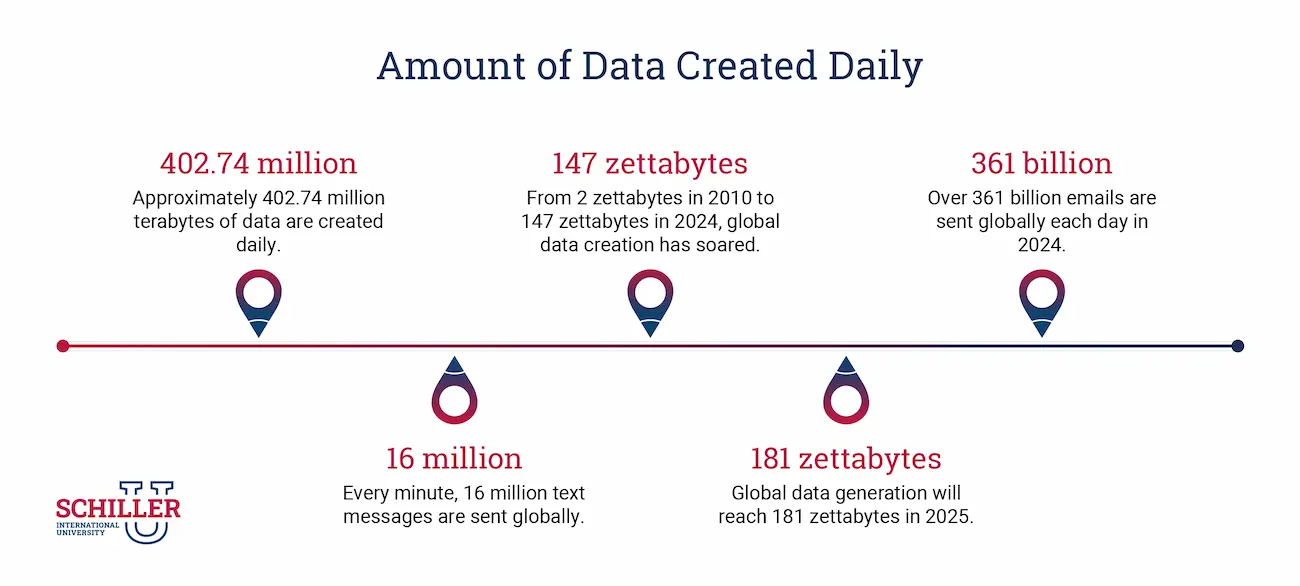
In 2024, the global volume of data created, captured, copied and consumed is around 149 zettabytes. (via Statista) It is estimated that the volume of data will reach 181 zettabytes by the end of 2025. A growing number of Internet of Things (IoT) devices, real-time data processing, and cloud-based storage are driving this growth.
A zettabyte is equivalent to 1 sextillion bytes (1,000,000,000,000,000,000,000 bytes), or 250 billion DVDs.
A recent analysis indicates that about 90% of the world's data has been generated in the past two years, and according to International Data Corporation (IDC), data storage volume is doubling about every four years.
This transformation data is being created from more sources and devices than ever. Businesses rely on data to make key business decisions for the company. Organizations increasingly use data driven insights to navigate markets, streamline processes, and improve customer relations. According to PwC, highly data-driven organizations are three times more likely to see decision-making improvements.
Interested in learning how data-driven decision-making in business can make you a better entrepreneur or team member? Read on to learn the benefits and steps to become more data-driven, as well as a number of steps you can take to become more analytical in your processes. For international students eyeing a future in business analytics, understanding how data shapes decisions are now key.
If you are fascinated by data and want to study how analytics performs in businesses, explore Schiller International University's BSc in Business Analytics program.
Understand the Business Analytics
The modern world is generating unprecedented amounts of data, fueled by a proliferation of sources and connected devices. Current estimations suggest that approximately 402.74 quintillion bytes of data are produced daily. Companies are increasingly dependent on using this vast sea of data to guide crucial organizational strategies.
This is where the power of business analytics becomes essential. By gathering and warehousing this information, organizations can dissect it from an operational viewpoint, extracting meaningful insights and generating robust metrics. These findings empower more strategic and well-informed decisions that can strengthen, optimize, or safeguard the organization.
Data-Driven Decisions Making in Business
Data-informed decision-making refers to utilizing factual information as the foundation for making choices and confirming a strategy prior to fully implementing it. Businesses use this approach in various ways. For instance, a company may:
- Gather feedback from customers to discover desired offerings, support, and functionalities.
- Observe user behavior when interacting with their products to identify potential areas for improvement before a full launch.
- Introduce a new product to a limited market to gauge its potential and understand how it might perform more broadly.
- Examine changes in population statistics to uncover potential prospects or challenges.
The precise method for integrating data into decision-making depends on factors such as the goals of your enterprise and the character and dependability of the available data.
While major companies and institutions have long valued data analysis, the unprecedented volume of information generated daily—exceeding 402.74 quintillion bytes—now makes it simpler than ever for organizations of all sizes to collect, analyze, and transform raw data into practical insights. While the practice of using information for decision-making has roots in history, the ease and scale at which it can be done today represents a significant shift.
Data generated by each year from 2010 to 2025 (estimated):
|
Year |
Data Generated |
Change Over Previous Year |
Change Over Previous Year |
|
2010 |
2 zettabytes |
– |
– |
|
2011 |
5 zettabytes |
↑ 3 zettabytes |
↑ 150% |
|
2012 |
6.5 zettabytes |
↑ 1.5 zettabytes |
↑ 30% |
|
2013 |
9 zettabytes |
↑ 2.5 zettabytes |
↑ 38.46% |
|
2014 |
12.5 zettabytes |
↑ 3.5 zettabytes |
↑ 38.89% |
|
2015 |
15.5 zettabytes |
↑ 3 zettabytes |
↑ 24% |
|
2016 |
18 zettabytes |
↑ 2.5 zettabytes |
↑ 16.13% |
|
2017 |
26 zettabytes |
↑ 8 zettabytes |
↑ 44.44% |
|
2018* |
33 zettabytes |
↑ 7 zettabytes |
↑ 26.92% |
|
2019* |
41 zettabytes |
↑ 8 zettabytes |
↑ 24.24% |
|
2020* |
64.2 zettabytes |
↑ 23.2 zettabytes |
↑ 56.59% |
|
2021* |
79 zettabytes |
↑ 14.8 zettabytes |
↑ 23.05% |
|
2022* |
97 zettabytes |
↑ 18 zettabytes |
↑ 22.78% |
|
2023* |
120 zettabytes |
↑ 23 zettabytes |
↑ 23.71% |
|
2024* |
147 zettabytes |
↑ 27 zettabytes |
↑ 22.5% |
|
2025* |
181 zettabytes |
↑ 34 zettabytes |
↑ 23.13% |
The Power of Data in Modern Business
Data is no longer just numbers. It is a strategic asset. It fuels innovation, informs strategy, and drives efficiency. Companies who can transform data effectively gain a significant competitive advantage. How?
- Improved Decision-Making:
Gone are the days of gut feelings alone. Data analysis provides evidence-based insights for more informed choices.
- Enhanced Customer Understanding:
Analyzing data on customer behaviors reveals preferences, needs, and pain points, enabling personalized experiences.
- Operational Efficiency:
Data driven insights highlight bottlenecks and areas for improvement, leading to streamlined processes and cost savings.
- Predictive Analytics:
Predictive models forecast future trends, allowing businesses to proactively adapt to changing market conditions.
A survey by McKinsey found that organizations using data driven strategies are 23 times more likely to acquire customers and six times more likely to retain them. (Source: McKinsey Global Institute).
Real-World Examples of Data-Driven Success
Let us examine a few case studies of companies who have leveraged data to achieve remarkable results.
- Netflix: The streaming giant uses data analysis to personalize recommendations, predict viewing habits, and optimize content acquisition, resulting in high customer satisfaction and retention.
- Amazon: E-commerce titan employs predictive analytics to forecast demand, optimize inventory management, and personalize marketing campaigns, driving sales and efficiency.
- Procter & Gamble: Consumer goods company utilizes data driven insights to understand consumer preferences, optimize product development, and tailor marketing messages, enhancing brand loyalty.
How Data Transforms Business Strategy
Data transforms business strategies by providing actionable insights. Businesses can now anticipate market trends, personalize customer experiences, and optimize their operations with unprecedented accuracy. This shift leads to more agile and responsive organizations.
- Personalized Marketing: Data enables businesses to tailor marketing messages and offers individual customer preferences.
- Customer Segmentation: Data analysis allows businesses to segment customers into distinct groups based on demographics, behaviors, and preferences, enabling targeted marketing efforts.
- Risk Management: By analyzing historical data, organizations can identify potential risks and develop strategies to mitigate them effectively.
- Supply Chain Optimization: Data-driven insights optimize supply chain operations by predicting demand, managing inventory levels, and improving logistics.
- Product Development: Data driven insights inform product development by identifying customer needs, preferences, and pain points, resulting in offerings that better meet market demands.
- Performance Monitoring: Businesses track performance metrics across various functions, using data to assess effectiveness, identify areas for improvement, and drive continuous optimization.
Case Studies: Data in Action
Examining real-world examples shows the transformative power of data driven insights. Companies across industries use data to improve operations, enhance customer experiences, and gain a competitive edge.
These case studies illustrate the practical applications of business analytics.
|
Industry |
Application |
Outcome |
|
E-commerce |
An e-commerce company analyzes customer browsing history, purchase patterns, and demographic data to personalize product recommendations, promotional offers, and website content. |
Increased sales, improved customer satisfaction, and higher conversion rates. |
|
Manufacturing |
A manufacturing plant uses sensor data and predictive analytics to monitor equipment performance, predict maintenance needs, and optimize production schedules. |
Reduced downtime, improved efficiency, and lower operating costs. |
|
Transportation |
A logistics company utilizes GPS data, traffic patterns, and weather forecasts to optimize delivery routes, minimize fuel consumption, and improve on-time delivery rates. |
Reduced transportation costs, improved delivery times, and enhanced customer service. |
|
Energy |
An energy provider leverages smart meter data and weather forecasts to predict energy demand, optimize grid operations, and promote energy conservation. |
Improved grid stability, reduced energy waste, and lower energy costs for consumers. |
|
Education |
A university analyzes student performance data, course evaluations, and demographic information to identify at-risk students, improve teaching methods, and enhance student outcomes. |
Increased graduation rates, improved student satisfaction, and enhanced academic reputation. |
Skills for Business Analytics Role
The global data and analytics job market is projected to grow from $61.9 billion in 2023 to $502.4 billion by 2032 (via Houlihan Lokey’s 2024 Report). To succeed in the business analytics industry, international students need a combination of technical and soft skills. Strong analytical abilities, proficiency in data visualization, and communication skills are paramount. A solid grasp of business principles is also essential.
- Technical Skills: Proficiency in tools like SQL, Python, and Tableau is crucial.
- Analytical Skills: The ability to interpret data analysis and extract meaningful insights is essential.
- Soft Skills: Communication, teamwork, and leadership skills enhance collaborative success.
A Quick Overview of these Skills:
|
Skill |
Description |
|
Data Visualization |
Visualizing data through charts, graphs, and dashboards is essential for presenting insights effectively. |
|
Programming |
Knowledge of programming languages such as Python or R for data analysis and automation. |
|
Data Analysis |
Ability to collect, clean, and interpret raw data into actionable insights. |
|
Statistical Analysis |
Applying statistical methods to analyze data, identify patterns, and make inferences is fundamental in business analytics roles. |
|
Machine Learning |
Proficiency in machine learning techniques is increasingly valuable for building predictive models and automating data analysis tasks. |
|
Business Acumen |
A strong understanding of business principles and practices is necessary to align data-driven insights with strategic goals. |
|
Communication and Storytelling |
Communicating complex findings clearly and persuasively to stakeholders is crucial for driving action and influencing business decisions. |
Impact and Career Opportunities
The emphasis on analytics in business significantly impacts career paths. Analytical and technical skills are now critical for businesses to compete, creating a high demand for data science and analytics expertise across industries. Professionals proficient in Business Intelligence tools like SAS and SAP are highly valuable, and business analytics or data analytics degrees equip individuals with these sought-after skills. Graduates can pursue various roles, including Intelligence Analysts, Senior Operations Analysts, and even leadership positions such as Chief Executive Officer (CEO), driving business success through data-driven strategies.
According to the Bureau of Labor Statistics, the management analyst positions are projected to grow by 11% by 2029, well above the average growth rate of four percent. The field necessitates a collaborative approach, offering data and analytics professionals unique career opportunities at the forefront of business.
Schiller's BSc in Business Analytics
Schiller International University offers a BSc in Business Analytics program, lasting 40 months (four years) and totaling 120 American Credits (240 ECTS). The program is designed to meet the growing demand for technology-savvy business analytics professionals. The curriculum includes general education courses such as "Introduction to Big Data and Artificial Intelligence", knowledge area courses such as "Data Visualization" and "Machine Learning", and elective courses such as "Organizational Psychology". With course outcomes focused on acquiring analytical skills, blending business and technical abilities, and developing digital strategies, Schiller International University equips students for success in the data-driven world.
Ready to shape the future with data?
Apply for a Bachelor of Science in Business Analytics at Schiller.
Discover Our Campuses